Mitt Romney

Mitt Romney is a Republican candidate in the 2008 Primary, 2008-2011, 2012 Primary, 2012 General elections. CLIP model was run on 59 speeches from his elections.


Overview

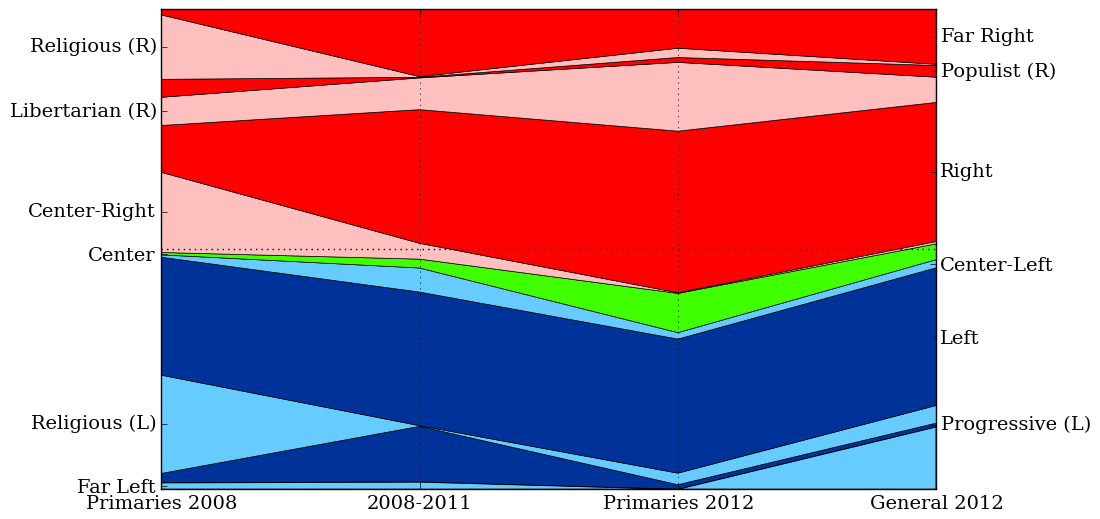
The chart and table below shows the ideological proportions inferred by CLIP for each election.

Ideology 2008 Primary 2008-2011 2012 Primary 2012 General
Total left 0.489 0.461 0.327 0.479
Left 0.246 0.278 0.279 0.287
Far Left 0.014 0.016 0.001 0.131
Center-Left 0.005 0.05 0.013 0.017
Progressive (L) 0.019 0.116 0.009 0.008
Religious (L) 0.205 0.001 0.024 0.037
Center 0.005 0.018 0.082 0.033
Total right 0.506 0.52 0.592 0.488
Right 0.097 0.278 0.337 0.29
Far Right 0.011 0.14 0.081 0.114
Libertarian (R) 0.059 0.066 0.143 0.053
Center-Right 0.167 0.033 0.001 0.005
Populist (R) 0.037 0.001 0.01 0.024
Religious (R) 0.134 0.001 0.019 0.002

Cue terms used in epoches

For each `stage` of the elections, you can view the posterior distributions inferred by CLIP for every cue term in his speeches, or an overview of the terms that were used during each epoch.

2008 Primary

In 2008 Primary, Mitt Romney gave 8 speeches. Click here to see a list of cue terms he used during this election.

# Title Length Cue terms Left Center Right
1 01.15.2008.Southfield.MI 858 27
0.381 0.002 0.617
2 02.07.2008.Washington.DC.Suspend 2731 64
0.47 0.009 0.521
3 03.02.2007.Washington.DC 2501 109
0.297 0.014 0.69
4 09.22.2006.Washington.DC 3063 74
0.546 0.003 0.451
5 09.22.2007.Mackinac.MI 2537 67
0.387 0.003 0.611
6 10.05.2006.Boston.MA 510 9
0.177 0.001 0.822
7 10.19.2007.Washington.DC 2873 86
0.407 0.002 0.592
8 12.06.2007.CollegeStation.TX 2897 65
0.851 0.003 0.146

2008-2011

In 2008-2011, Mitt Romney gave 13 speeches. Click here to see a list of cue terms he used during this election.

# Title Length Cue terms Left Center Right
1 01.30.2009.Baltimore.MD 2663 82
0.651 0.006 0.343
2 02.11.2011.Washington.DC 1945 71
0.37 0.045 0.585
3 02.18.2010.Washington.DC 3539 121
0.496 0.048 0.455
4 02.27.2009.Washington.DC 3574 109
0.566 0.004 0.43
5 03.05.2011.Bartlett.NH 2952 95
0.187 0.009 0.804
6 03.31.2009.Washington.DC 4211 109
0.58 0.004 0.417
7 05.15.2009.Phoenix.AZ 3160 92
0.516 0.017 0.467
8 06.01.2009.Washington.DC 3688 116
0.329 0.005 0.666
9 06.02.2011.Stratham.NH.Announce 2659 78
0.534 0.014 0.452
10 09.03.2008.Minneapolis.MN 1084 48
0.469 0.016 0.514
11 09.17.2010.Washington.DC 2807 70
0.339 0.075 0.586
12 09.19.2009.Washington.DC 2563 97
0.583 0.007 0.41
13 10.19.2010.Washington.DC 3381 92
0.352 0.004 0.643

2012 Primary

In 2012 Primary, Mitt Romney gave 19 speeches. Click here to see a list of cue terms he used during this election.

# Title Length Cue terms Left Center Right
1 01.10.2012.Manchester.NH 1289 40
0.57 0.084 0.347
2 01.31.2012.Tampa.FL 1232 38
0.604 0.027 0.369
3 02.04.2012.LasVegas.NV 1234 47
0.435 0.019 0.546
4 02.10.2012.Washington.DC 3755 101
0.368 0.087 0.545
5 02.24.2012.Detroit.MI 2443 112
0.248 0.021 0.731
6 02.28.2012.Novi.MI 2182 51
0.372 0.032 0.596
7 03.06.2012.Boston.MA 1809 49
0.362 0.038 0.601
8 03.19.2012.Chicago.IL 2655 97
0.282 0.067 0.651
9 03.20.2012.Schaumburg.IL 1333 44
0.299 0.209 0.492
10 03.30.2012.Appleton.WI 3377 118
0.383 0.17 0.447
11 04.03.2012.Milwaukee.WI 1688 54
0.336 0.231 0.433
12 04.04.2012.Washington.DC 2944 104
0.228 0.111 0.661
13 04.13.2012.StLouis.MO 3045 103
0.359 0.153 0.488
14 04.24.2012.Manchester.NH.SecureNom 1751 42
0.452 0.081 0.467
15 08.30.2011.SanAntonio.TX 2448 74
0.45 0.147 0.404
16 09.02.2011.Tampa.FL 2088 79
0.306 0.01 0.684
17 10.07.2011.Charleston.SC 3081 111
0.157 0.014 0.828
18 10.08.2011.Washington.DC 2231 84
0.341 0.041 0.618
19 11.04.2011.Washington.DC 3203 142
0.097 0.009 0.894

2012 General

In 2012 General, Mitt Romney gave 19 speeches. Click here to see a list of cue terms he used during this election.

# Title Length Cue terms Left Center Right
1 05.12.2012.Lynchburg.VA 2636 49
0.833 0.029 0.138
2 05.23.2012.Washington.DC 3243 103
0.857 0.036 0.106
3 05.25.2012.DesMoines.IA 2421 82
0.257 0.03 0.714
4 06.07.2012.StLouis.MO 1997 82
0.198 0.029 0.773
5 06.21.2012.Washington.DC 2441 84
0.253 0.019 0.729
6 07.11.2012.Washington.DC 3292 118
0.709 0.02 0.271
7 07.24.2012.Reno.NV 3689 104
0.361 0.016 0.622
8 07.29.2012.Jerusalem.ISRAEL 2424 61
0.294 0.01 0.695
9 08.11.2012.Norfolk.VA 893 50
0.699 0.011 0.29
10 08.14.2012.Chillicothe.OH 2119 85
0.37 0.04 0.59
11 08.30.2012.Tampa.FL.Convention 4565 119
0.545 0.065 0.39
12 09.11.2012.Reno.NV 2536 56
0.761 0.022 0.217
13 09.17.2012.LosAngeles.CA 3064 131
0.251 0.037 0.712
14 09.25.2012.NewYork.NY 2476 79
0.512 0.029 0.459
15 10.08.2012.Lexington.VA 3843 112
0.485 0.03 0.485
16 10.26.2012.Ames.IA 3030 140
0.341 0.061 0.598
17 11.02.2012.WestAllis.WI 2808 77
0.376 0.051 0.573
18 11.07.2012.Boston.MA 744 9
0.781 0.027 0.192
19 12.07.2012.Washington.DC 2321 65
0.329 0.018 0.652